
Exercise 1; Displaying and measuring a sinusoid.
Frequency = 5kHz
Peak to peak amplitude = 5V

We found the period to be 200 micro seconds.
Our peak to peak amplitude was measured to be 5V, which were the 5 squares total
The zero to peak amplitude was 2.5V
The anticipated RMS value was 0.
We used the DMM to measure voltage values.
VDC = 0.029 +/- .0001V
VAC = 1.60+/-.01V
How does VAC compare to the scope calculations?
(1.60+/-.01)2.5 = 0.640 +/- 0.0040 ~ 0.7 ~ 1/sqrt(2)
Exercise 2: Including a DC offset.
We added a +2.5V DC offset and the DC coupling looked like this:

The AC coupling looked like:

There was no major difference in DC coupling.
The values of measured voltages were:
VDC = 2.53 +/- .02V
VAC = 1.634 +/- .001 V,
which agree with the graphs above.
Exercise 3: Displaying and measuring a square wave with offset.
We changed the settings in the o-scope to measure square waves:
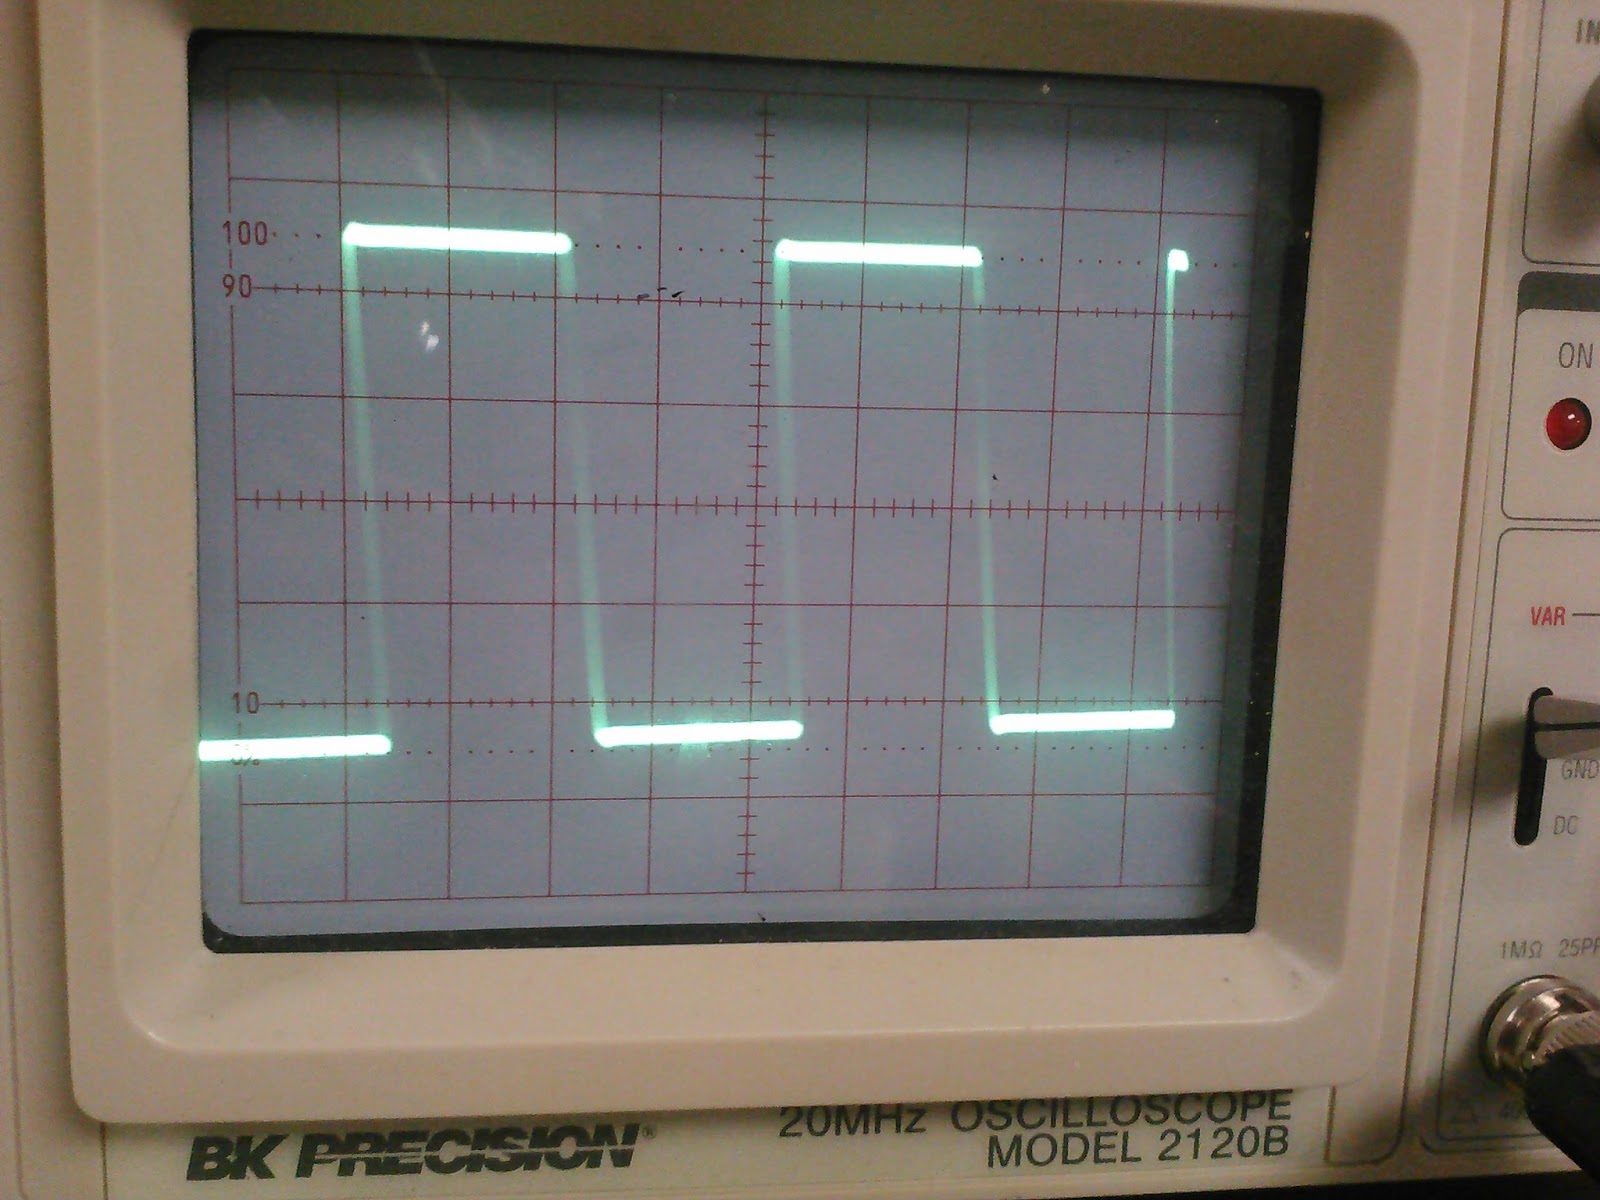
Using the DMM we measured the voltages;
VDC: 2.53 +/-.01V
VAC: 2.53
RMS = sqrt(2.5^2 * 100/100) = 2.5
Both AC and DC coupled signals looked alike.
Exercise 4: Measuring mystery signals.
We were given the following graph:

Due to the super fast speed at which the graph was moving, the camera wasn't able to capture the whole graph.
DC Voltage = 0.20V
Frequency = 2 kHz
Peak to peak amplitude = 4V
No comments:
Post a Comment